The slowdown in the housing market has contributed to profits slump at Savills, which saw a 18% decline in revenue from UK residential transactions. Overall the group’s pre-tax profits fell by 64% to £55.4m, which …
Glenhawk, the UK short-term lender, is offering reduced legal and valuation fees. Available to all applications received by 27 March, the promotion will apply on all loans within £10m, with Glenhawk covering up to £3,000 …
In reply to Kenneth. If Amigo had gone bust in December 2020, then in an administration the rules say payments someone makes have to be refunded in full if they no longer owe that debt …
Are you a religious person? Do you believe that the human experience is prearranged, preordained, fated? Or…do you believe that destiny is like dough? Continuously shaped and moulded as we move along? Well, here’s …

Instacart, a leading name in the app-based grocery delivery service sector, marked a significant milestone by officially going public on September 18, 2023. This long-anticipated move comes after a period of rapid growth, making the …

Updated: 3/14/2024 Investors’ anticipation for the VinFast IPO culminated as the company began trading on August 15, 2023. This marks a significant milestone for the Vietnamese EV automotive company, signaling its ambitious stride into the …
After decades in business, Reddit (Nyse: RDDT) has finally decided to go public making it the first social media to do so since Snap (Nasdaq: SNAP) in 2017. This 20-year-old social media platform has soared …
These Are the Top Technical Indicators to Use When Trading Penny Stocks Trading penny stocks offers a unique opportunity for investors to gain significant returns on their investment, despite the generally lower price point of …

Everyone loves a get rich quick story. No one likes to get rich slowly story… because that’s boring. But slow and boring have their place. In fact, slow and boring are often some of the …
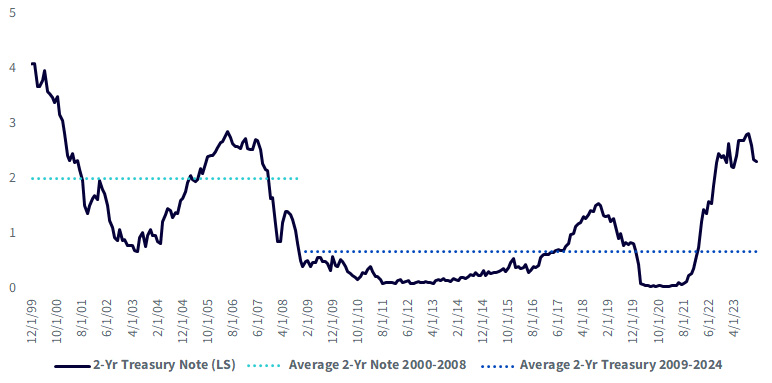
The new rate regime has presented investors with a fixed income backdrop that hasn’t been witnessed in more than a decade and a half. Against this backdrop, bond portfolio decision-making has been presented with a new, …
Highlights Roundstone’s Founder and President Mike Schroeder joined the Voices of Self-Funding podcast with host Ramesh Kumar to discuss why self-funded stop-loss captives have exponentially grown the small to midsize market for self-funded insurance. Roundstone …
Get all latest content delivered to your email a few times a month.