On Monday, US stocks rebounded with the S&P 500 and Nasdaq Composite both gaining ground. The broader market index rose 0.58%, closing at 4,489.72, while the Nasdaq surged by 1.05% to end at 13,788.33. In contrast, the Dow Jones Industrial Average edged up 0.07%, finishing at 35,307.63.
Nvidia, a key chip company, saw a notable resurgence, its shares climbing 7.1% after an 8.5% slump the prior week. The boost came from Morgan Stanley reaffirming Nvidia as a top pick ahead of its earnings report. Other chip stocks followed suit, with the VanEck Semiconductor ETF (SMH) up 3%, despite a more than 6% decline in August.
These gains unfolded amid a recent struggle for stocks to maintain momentum in the latter part of 2023’s summer. While the S&P 500 and Nasdaq faced declines of 0.3% and 1.9% respectively in the previous week, the Dow bucked the trend, posting a 0.6% gain in the same period – its fourth positive week in five.
Looking ahead, the upcoming week was poised to provide insights into the US consumer’s state, with anticipated earnings reports from major companies like Home Depot, Target, and Walmart, along with the release of July’s retail sales data. These reports followed mixed inflation data from the previous week, which showed a moderated yet still elevated price increase above the Federal Reserve’s 2% target.

Data by Bloomberg
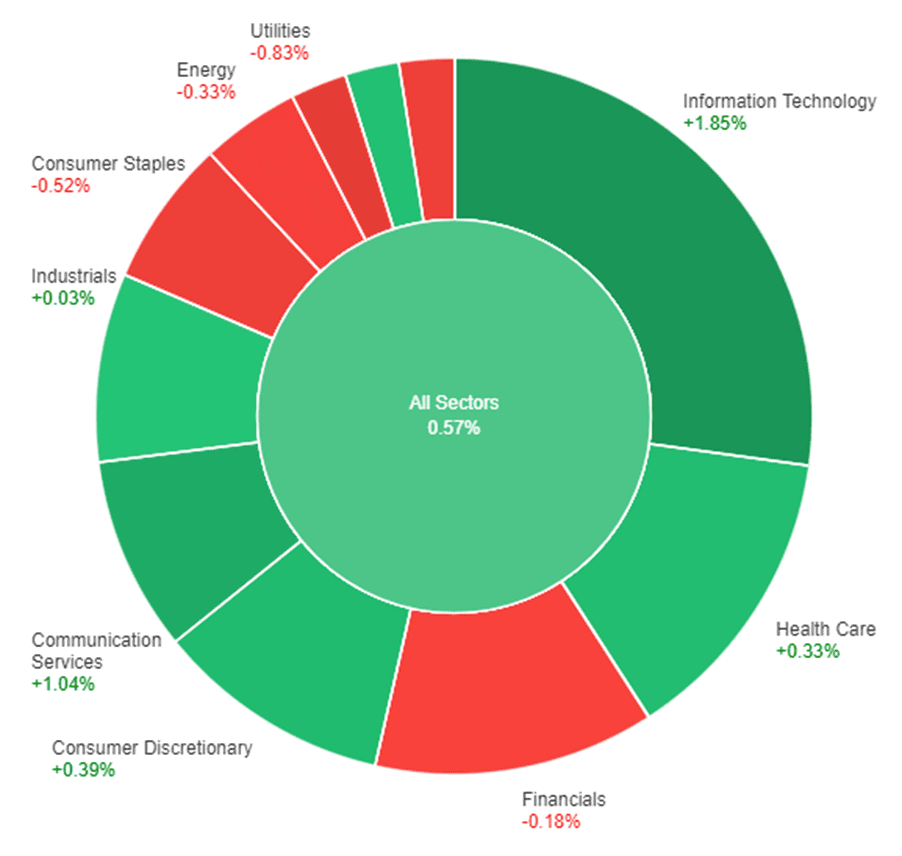
On Monday, the US stock market exhibited varied sectoral performance. The overall market saw a positive movement of 0.57%. The Information Technology sector led the gains with an impressive 1.85% increase, followed by Communication Services at +1.04%, and Consumer Discretionary at +0.39%. Health Care and Materials sectors also contributed positively, rising by 0.33% and 0.19% respectively. However, some sectors experienced slight gains or remained nearly unchanged, including Industrials (+0.03%).
On the other hand, several sectors faced declines. Financials registered a decrease of -0.18%, Energy was down by -0.33%, while Consumer Staples and Real Estate both experienced more pronounced declines at -0.52% and -0.54% respectively. The Utilities sector saw the most significant decrease, ending the day with a decline of -0.83%.
Major Pair Movement
The US Dollar Index achieved its highest daily close in over a month, surpassing 103.15, supported by rising US yields even as the Federal Reserve’s stability is expected. Retail Sales data and NY Empire Manufacturing Index awaited. The Euro faced fluctuations, briefly dipping below 1.0900 but recovering, while GBP/USD stabilized around 1.2700 after hitting 1.2616, accompanied by the upcoming UK employment and inflation reports.
USD/JPY extended gains, reaching its highest daily close near 145.50 since November. Japan’s Q2 GDP and Industrial Production data anticipated. USD/CHF hit a one-month peak before retreating, with Swiss Producer and Import Price Index due. USD/CAD maintained an upward trend above 1.3400 ahead of Canada’s CPI report. AUD/USD declined for a fifth day due to commodity drops, RBA minutes expected. NZD/USD hit a November-low close below 0.6000 ahead of the RBNZ decision. Gold and Silver slid but stabilized, Gold above $1,900 and Silver around $22.55.
Picks of the Day Analysis
EUR/USD (4 Hours)
US Dollar Strengthens as EUR/USD Faces Bearish Pressure
The EUR/USD faced downward pressure as it dropped below key moving averages, testing levels below 1.0900. While a recovery from the lows could alleviate some bearish sentiment, the overall trend remains downward, contributing to the US Dollar’s resilience across the market.
The US Dollar Index closed above 103.00, achieving its highest daily close in over a month on Tuesday, driven by rising US Treasury yields. Despite expectations of an unchanged interest rate policy by the Federal Reserve (Fed), the Greenback remains robust. US yields continue their upward trajectory, with the 10-year approaching 4.20% and the 2-year nearing 5%. Retail Sales data from the US is scheduled for release. Meanwhile, the Euro faced losses against the Swiss Franc and the Pound on Monday, partly due to Germany’s Wholesale Price Index dropping 0.2% in July, although the annual rate performed slightly below expectations. The upcoming ZEW Survey release will provide further insights into the Euro’s performance.

Based on technical analysis, the EUR/USD exhibited a downward movement on Monday and initiated a push towards the lower boundary of the Bollinger Bands. Nevertheless, it subsequently experienced a minor upward shift, with the potential to rise further towards the central line of the Bollinger Bands. The Relative Strength Index (RSI) presently stands at 38, signifying that the EUR/USD is currently in a consolidation phase with a slight bearish undertone.
Resistance: 1.0935, 1.1038
Support: 1.0874, 1.0789
XAU/USD (4 Hours)
XAU/USD Gold Prices Plunge Amidst Rising US Dollar Demand
Gold prices experienced a sharp decline on Monday due to increased demand for the US Dollar in a risk-averse climate. The week began with investors closely monitoring China, where real estate giant Country Garden Holdings’ warning of a $7.6 billion first-half loss triggered concerns of contagion. This led to a surge in speculative interest towards the safe-haven US Dollar.
Although worries eased briefly during European trading hours, they resurfaced before Wall Street’s opening. XAU/USD dropped to $1,902.68 per troy ounce, almost matching July’s low. However, the positive sentiment on Wall Street interrupted the US Dollar’s rally, allowing XAU/USD to recover slightly from its low. While equities posted modest gains, they curtailed the downside for the American currency.
Amidst a sparse macroeconomic calendar, the focus remains on the upcoming releases from the United States and the United Kingdom. The US is set to reveal Retail Sales data on Tuesday, while the UK will provide updates on employment and inflation in the coming days.

Based on technical analysis, the XAU/USD witnessed a slight decrease on Monday, the price managed to reach the lower band of the Bollinger Bands during this movement. At present, the price is retracing higher. The Relative Strength Index (RSI) is currently at 37, indicating that the XAU/USD pair is exhibiting a somewhat bearish sentiment.
Resistance: $1,912, $1,923
Support: $1,902, $1,892
Economic Data
| Currency | Data | Time (GMT + 8) | Forecast |
|---|---|---|---|
| AUD | Monetary Policy Meeting Minutes | 09:30 | |
| AUD | Wage Price Index q/q | 09:30 | 0.9% |
| GBP | Claimant Count Change | 14:00 | 19.6K |
| CAD | CPI m/m | 20:30 | 0.3% |
| USD | Retail Sales m/m | 20:30 | 0.4% |
| USD | Empire State Manufacturing Index | 20:30 | -0.9 |
Start trading now — click here to create your live VT Markets account.
The post US Stocks Rebound as Tech and Chip Sectors Drive Gains, Amidst Mixed Market Trends first appeared on VT Markets.


