

$XOM 1H Elliott Wave Chart 12.29.2023:
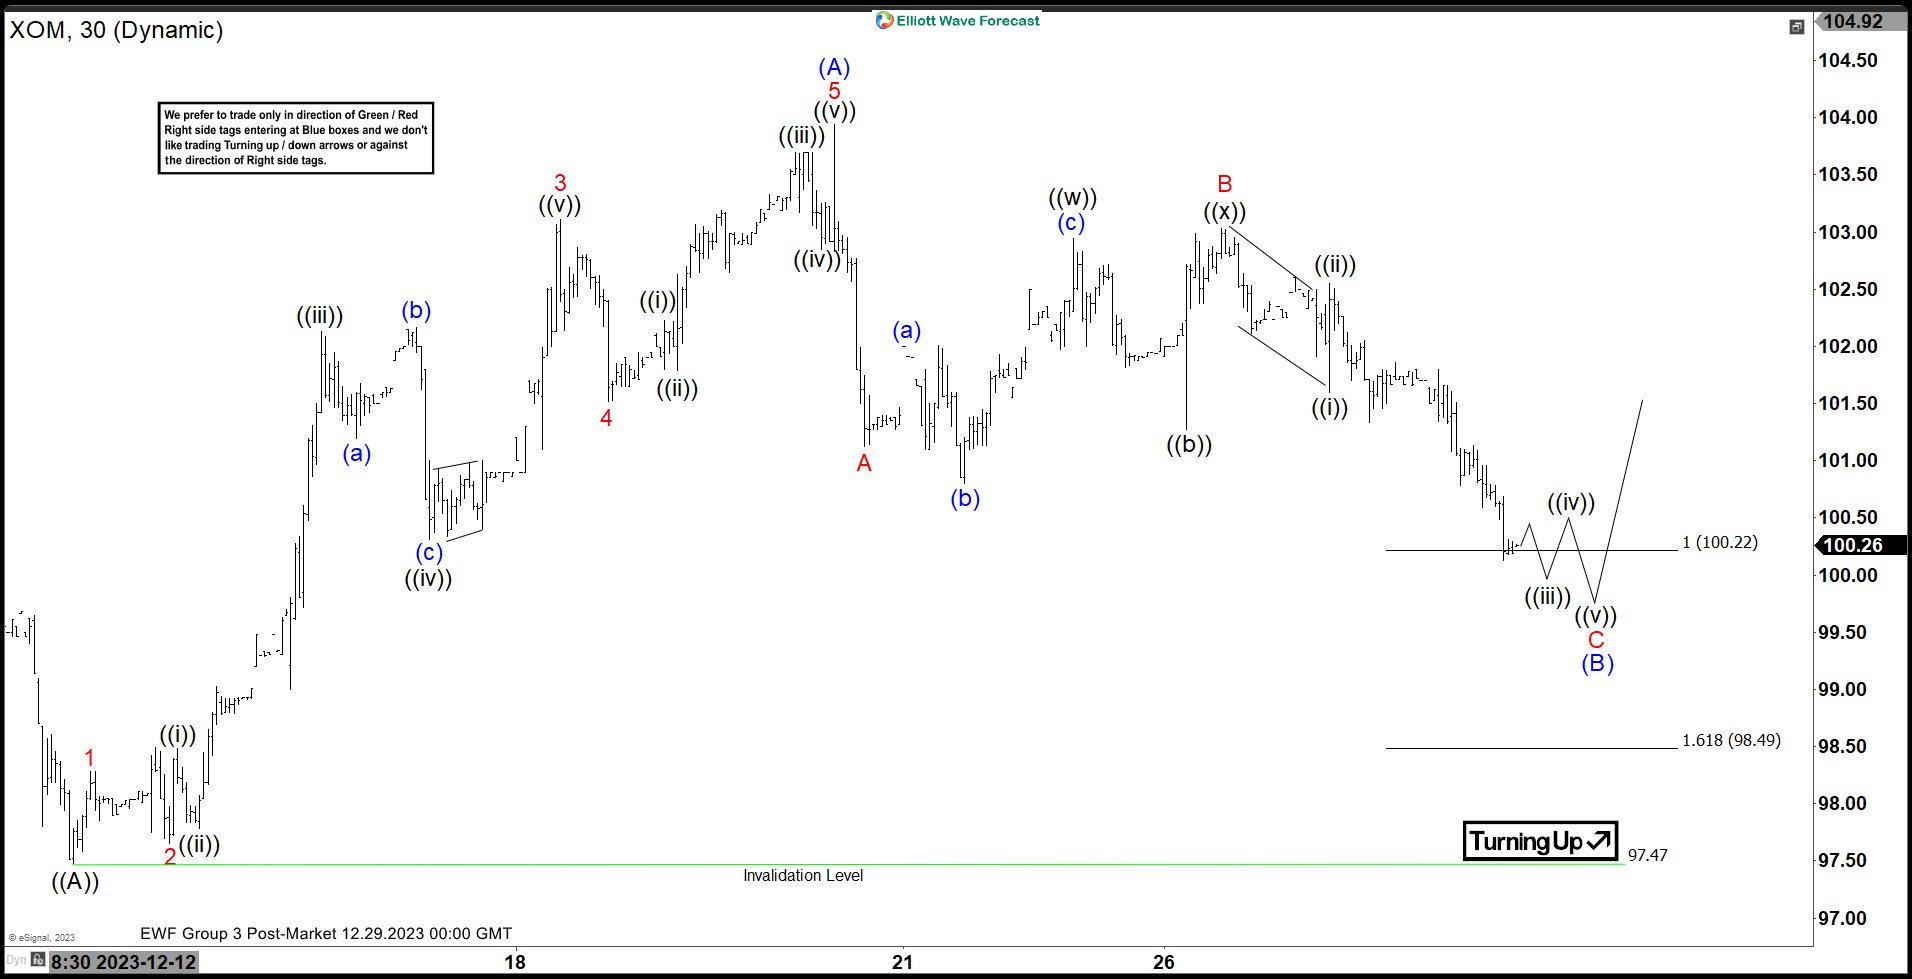 Here is the 1H Elliott Wave count from 12.12.2023. We expected the pullback to find buyers at Blue (B) in a 3 swing structure (ABC) at 100.22 – 98.49.
$XOM 1H Elliott Wave Chart 1.03.2024:
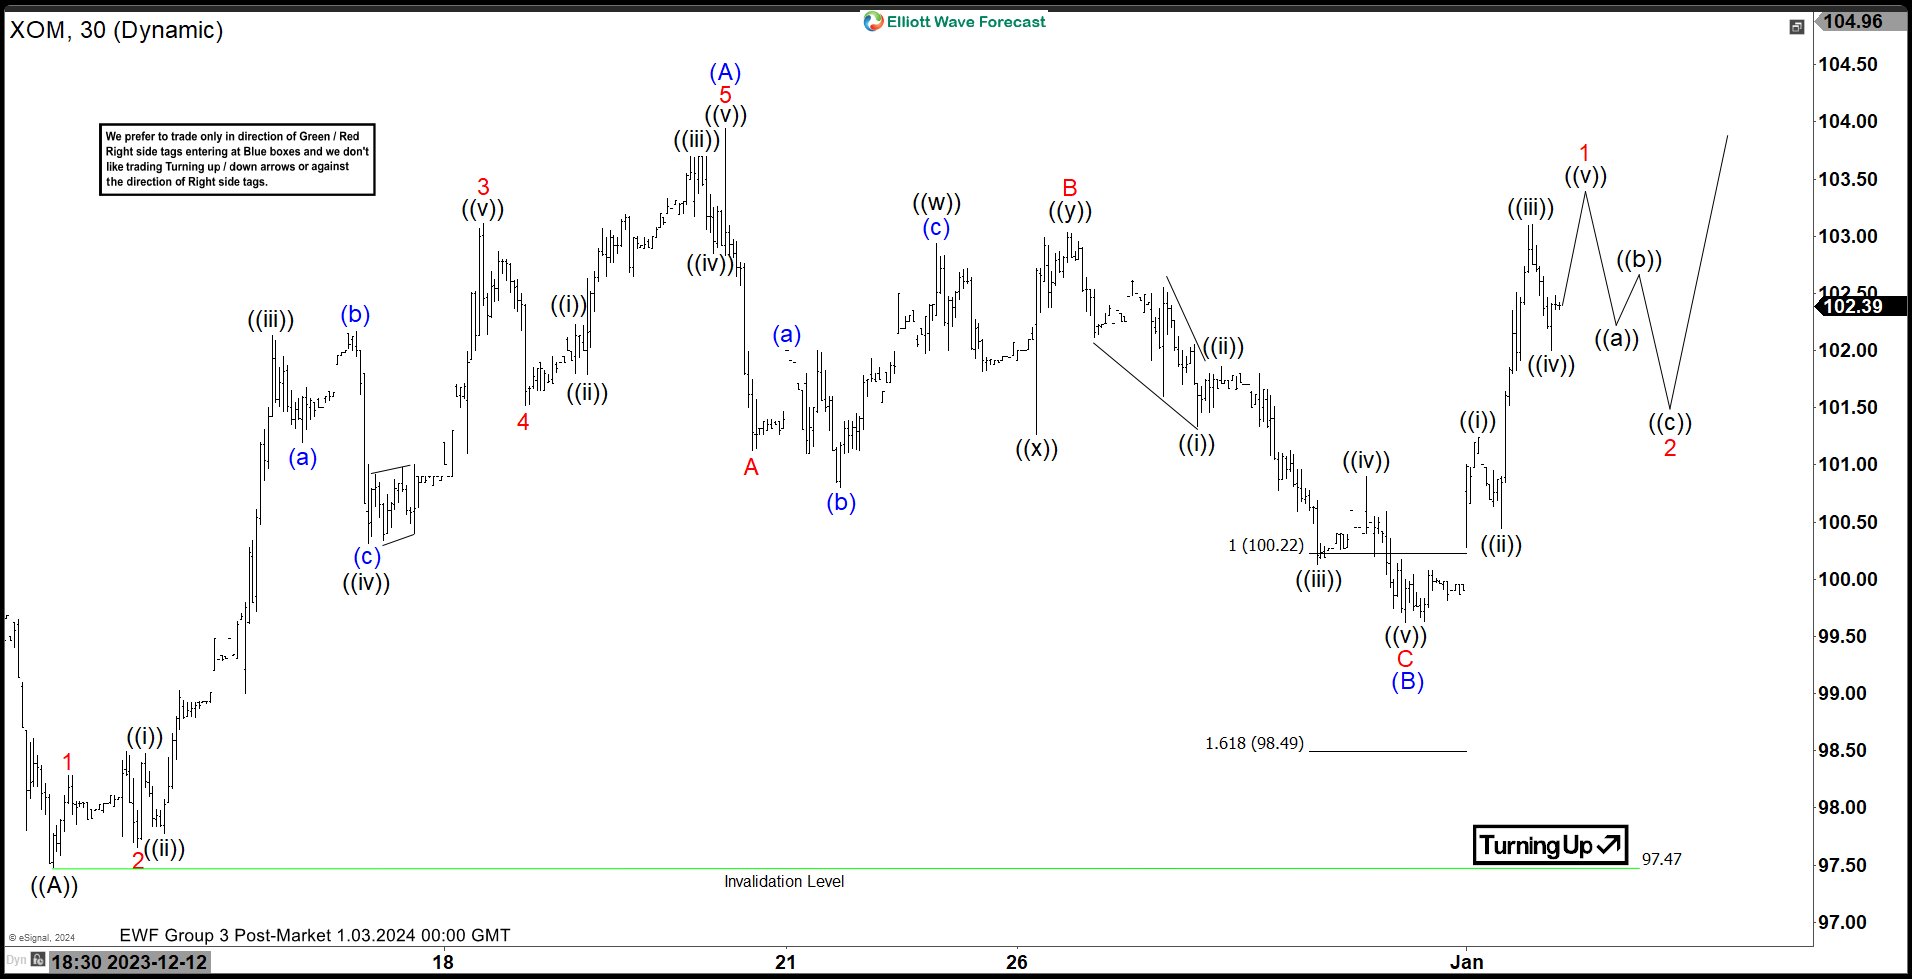 Here is the 1H update from 1.03.2024 showing the bounce taking place as expected. The stock reacted higher after reaching the extreme area allowing longs to get into a risk free position.
$XOM Elliott Wave Video Analysis
Elliott Wave Forecast
We cover 78 instruments, but not every chart is a trading recommendation. We present Official Trading Recommendations in the Live Trading Room. If not a member yet, Sign Up for Free 14 days Trial now and get access to new trading opportunities. Welcome to Elliott Wave Forecast!
The post Exxon Mobil Corp ($XOM) Found Buyers from Extreme Area. appeared first on Elliott Wave Forecast : Analysis and Trading Signals.

